Note
Click here to download the full example code
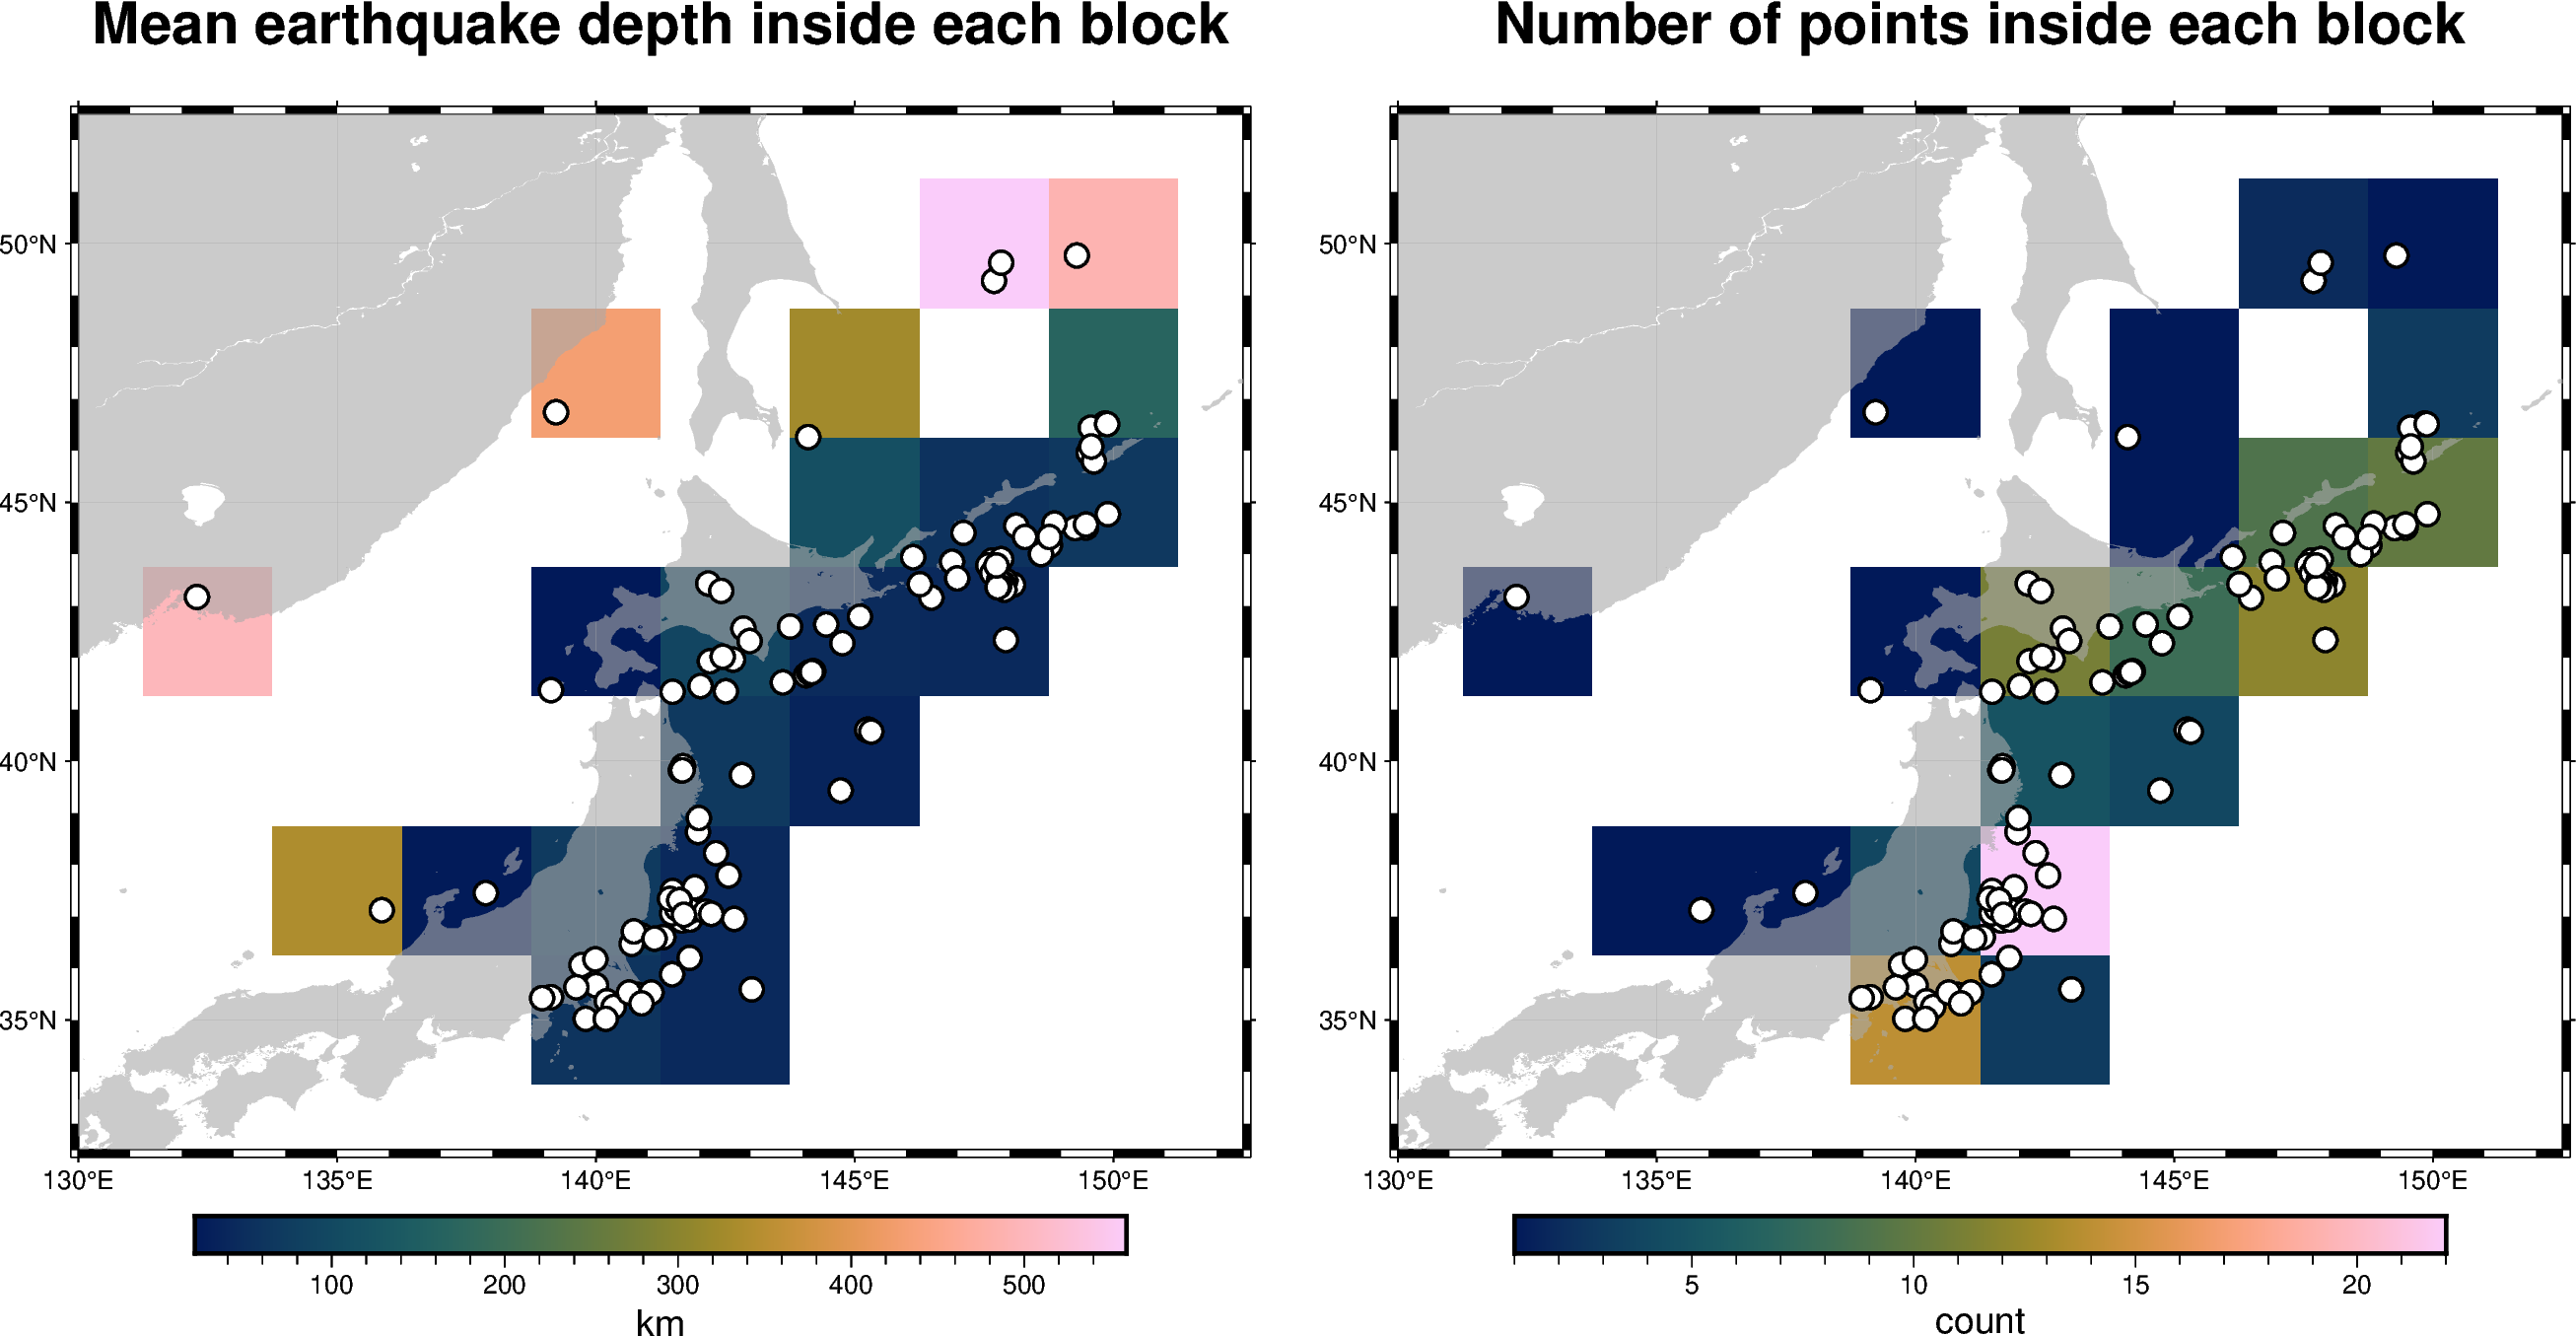
Blockmean
The pygmt.blockmean method allows to calculate block averages and
to report the number of points inside each block.
Out:
<IPython.core.display.Image object>
import pygmt

# load sample data
data = pygmt.datasets.load_japan_quakes()
# select only needed columns
data = data[["longitude", "latitude", "depth_km"]]

# Set the region for the plot
region = [130, 152.5, 32.5, 52.5]
# Define spacing in x and y direction (150 by 150 minute blocks)
spacing = "150m"

fig = pygmt.Figure()

# Calculate mean depth in km from all events within 150x150 minute
# bins using blockmean
df = pygmt.blockmean(data, region=region, spacing=spacing)
# convert to grid
grd = pygmt.xyz2grd(df, region=region, spacing=spacing)

fig.grdimage(
    grd,
    region=region,
    frame=["af", '+t"Mean earthquake depth inside each block"'],
    cmap="batlow",
)
# plot slightly transparent landmasses on top
fig.coast(land="darkgray", transparency="40")
# plot original data points
fig.plot(
    x=data.longitude, y=data.latitude, style="c0.3c", color="white", pen="1p,black"
)
fig.colorbar(frame=["x+lkm"])

fig.shift_origin(xshift="w+5c")

# ----------------------------------------------------
# Calculate number of total locations within 150x150 minute bins via
# blockmean's summary parameter
df = pygmt.blockmean(data, region=region, spacing=spacing, summary="n")
grd = pygmt.xyz2grd(df, region=region, spacing=spacing)

fig.grdimage(
    grd,
    region=region,
    frame=["af", '+t"Number of points inside each block"'],
    cmap="batlow",
)
fig.coast(land="darkgray", transparency="40")
fig.plot(
    x=data.longitude, y=data.latitude, style="c0.3c", color="white", pen="1p,black"
)
fig.colorbar(frame=["x+lcount"])

fig.show()
Total running time of the script: ( 0 minutes 4.658 seconds)